92 Maps
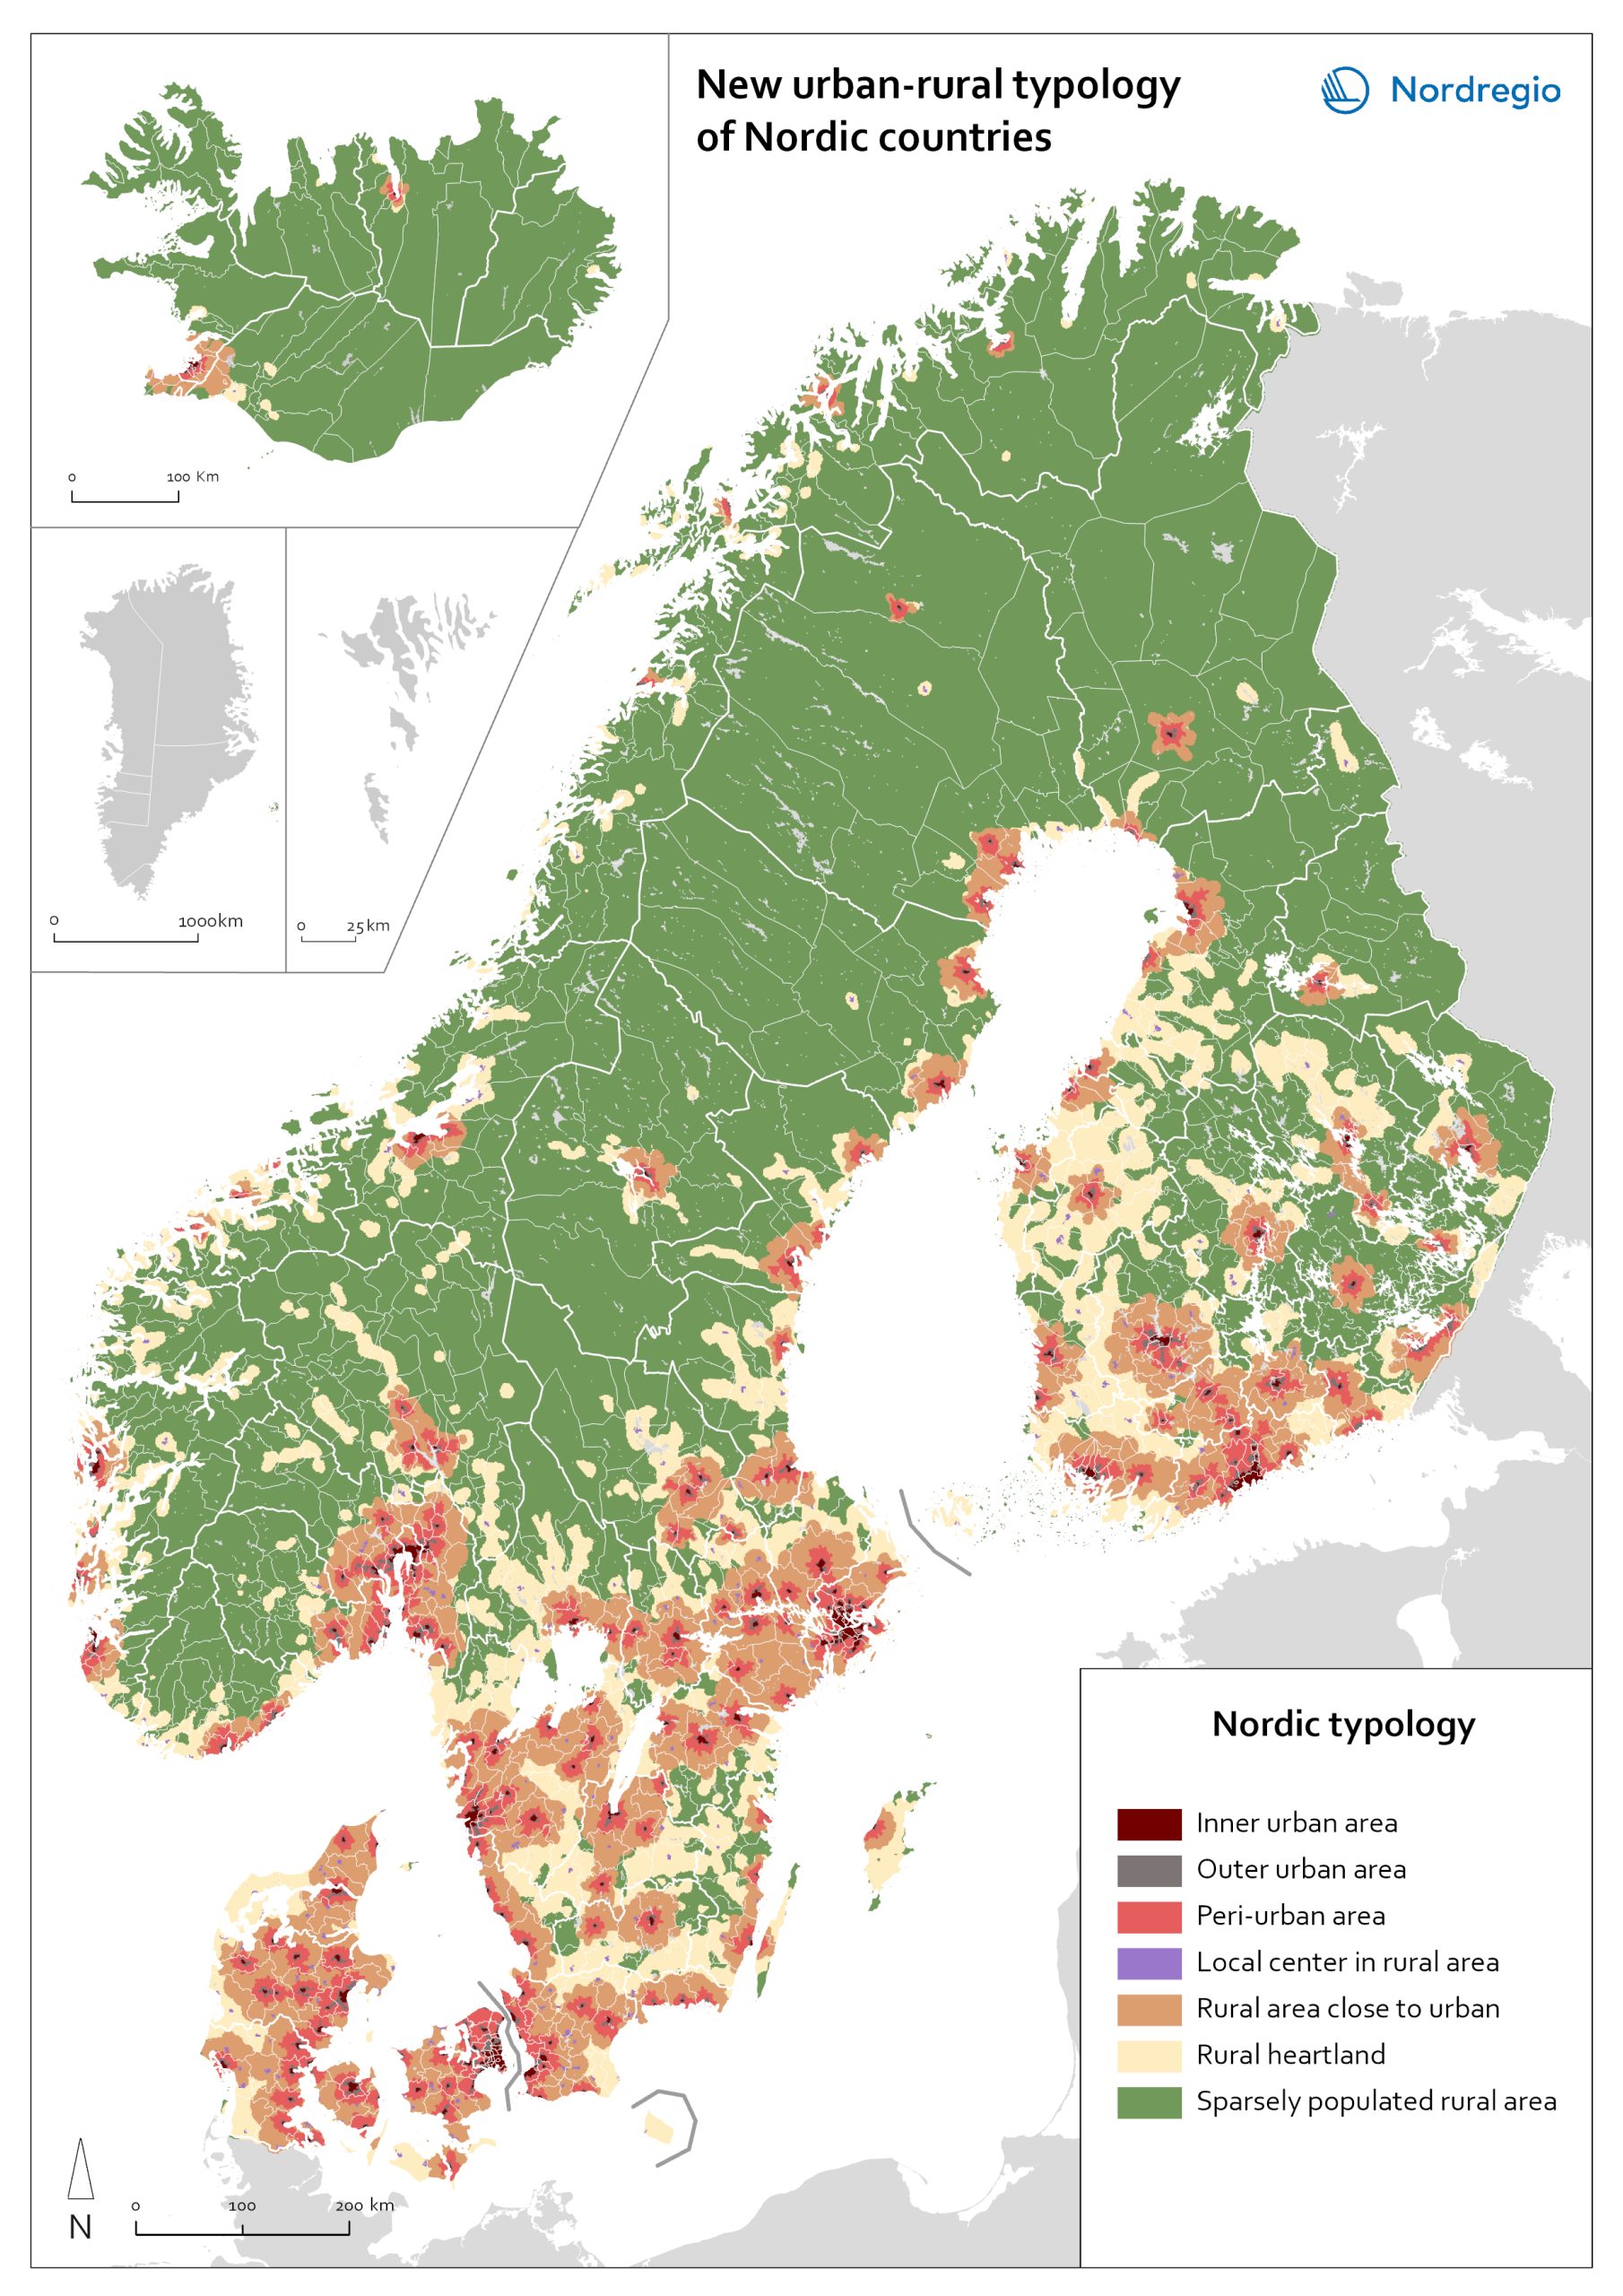
New urban-rural typology of Nordic countries
A map portrays a new urban-rural typology based on the grid-level data. New Nordic urban-rural typology is a grid-based classification of areas developed by the Nordic Thematic groups 2021-2024 to enable more accurate cross-Nordic statistical comparisons. The seven classes are defined based on population density, proximity measures and land cover parameters. Read more about the typology here . Inner urban area is the most densely populated part of the urban core. Urban cores are clustered cells summing up to at least 15 000 inhabitants, and these are divided into Inner and Outer urban areas based on density criterion (population density and building floor space). Outer urban area is the least densely populated part of the urban core. Urban core areas are clustered cells with at least 15 000 inhabitants, and these are divided into Inner and Outer urban areas based on density criterions (population density and building floorspace). Peri-urban area is the intermediate zone between urban core and the rural. It is based on generalized travel-time estimates from the edges of outer urban areas (6 min travel-time zones) and smaller urban settlement (4,5 min travel-time zones). Local centers in rural areas are population centers located outside urban areas, small towns and large parish villages where population is between 5000-14999 inhabitants. Rural areas close to urban areas have a rural character that are functionally connected and close to urban areas. In average this means 20-30 of minutes’ drive time from the edge of outer urban area. This class overwrites the area classes ‘Rural heartland’ and ‘Sparsely populated rural areas’. Rural heartland. Rural areas with intensive land use, with a relatively dense population and a diverse economic structure at the local level. Most of the agricultural land is in this class. Sparsely populated rural areas. Sparsely populated areas with dispersed small settlements that are located at a distance from each other.…
 2023 January
 - Administrative and functional divisions
- Nordic Region
New urban-rural typology of Nordic countries
A map portrays a new urban-rural typology based on the grid-level data. New Nordic urban-rural typology is a grid-based classification of areas developed by the Nordic Thematic groups 2021-2024 to enable more accurate cross-Nordic statistical comparisons. The seven classes are defined based on population density, proximity measures and land cover parameters. Read more about the typology here . Inner urban area is the most densely populated part of the urban core. Urban cores are clustered cells summing up to at least 15 000 inhabitants, and these are divided into Inner and Outer urban areas based on density criterion (population density and building floor space). Outer urban area is the least densely populated part of the urban core. Urban core areas are clustered cells with at least 15 000 inhabitants, and these are divided into Inner and Outer urban areas based on density criterions (population density and building floorspace). Peri-urban area is the intermediate zone between urban core and the rural. It is based on generalized travel-time estimates from the edges of outer urban areas (6 min travel-time zones) and smaller urban settlement (4,5 min travel-time zones). Local centers in rural areas are population centers located outside urban areas, small towns and large parish villages where population is between 5000-14999 inhabitants. Rural areas close to urban areas have a rural character that are functionally connected and close to urban areas. In average this means 20-30 of minutes’ drive time from the edge of outer urban area. This class overwrites the area classes ‘Rural heartland’ and ‘Sparsely populated rural areas’. Rural heartland. Rural areas with intensive land use, with a relatively dense population and a diverse economic structure at the local level. Most of the agricultural land is in this class. Sparsely populated rural areas. Sparsely populated areas with dispersed small settlements that are located at a distance from each other.…
- 2023 January
- Administrative and functional divisions
- Nordic Region


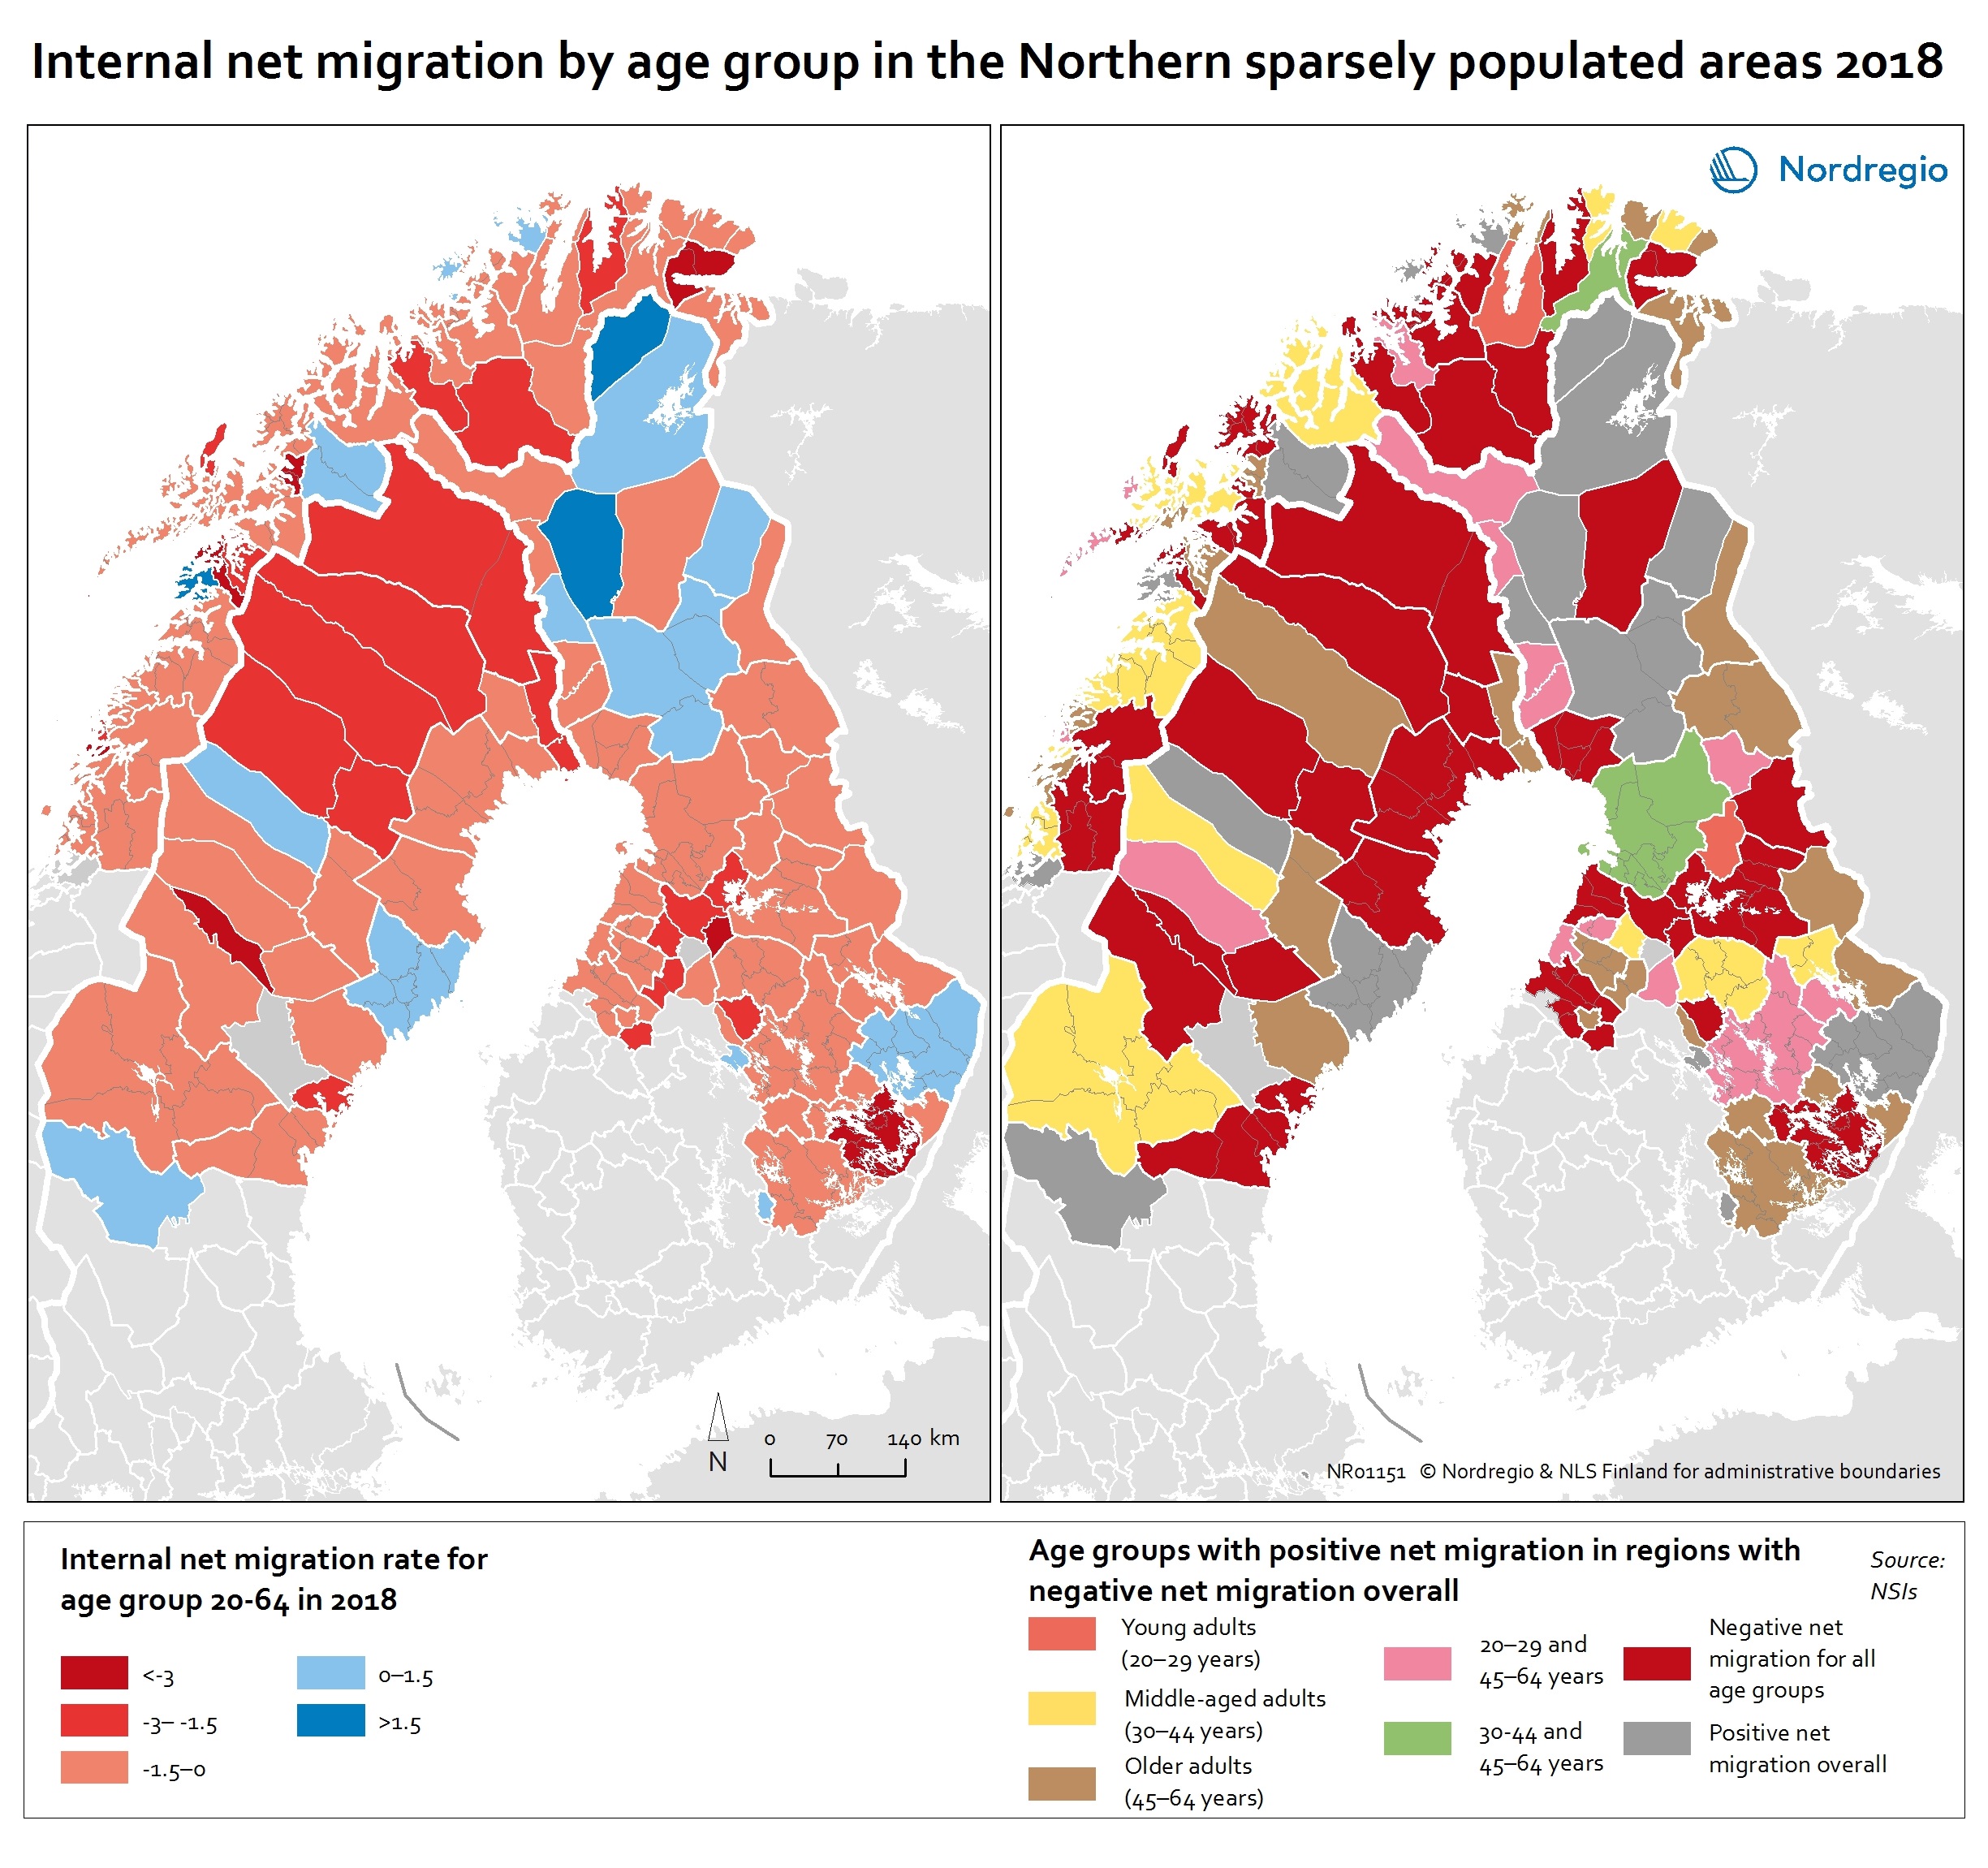
Internal net migration by age group in the Northern sparsely populated areas 2018
This map shows the internal net migration rate in 2018 (left map) and net migration by age group (right map) in local labour market areas of the Northern sparsely populated areas in 2018 The map on left shows the internal net migration rate in the NSPAs in 2018. Although many regions experienced negative net migration, this was not the case for all segments of the population. The map on the right of shows the age groups in which more people moved in than moved out, despite these regions having negative net migration overall. The red colours on the map on the left indicates a net out-migration, while the blue colours indicate a positive net migration. In the map on the right, the red colours indicate net out-migration for all age groups and the grey positive net migration overall. The other colours indicate age groups with a positive net migration (while having negative net migration overall). Inward and outward migration are slightly different in the local labour market areas (LLMAs) compared to the independent labour markets. Among the LLMAs, Rovaniemi is the only one that has positive net migration in all age groups. This positive development may be due to the number of governmental offices, the strength of the tourism industry and the presence of two universities. On the contrary, 18 local labour market areas– four in Sweden, nine in Norway and five in Finland – have negative net migration in all age groups. Out-migration of young adults is seen in most of LLMAs, the exceptions being Umeå, Målsev, Joensuu and Oulu. The inflows of young adults in these regions reflect the presence of the universities in Umeå, Joensuu and Oulu and the army bases in Målselv. Despite this positive inflow, most of these LLMAs are unable to retain adults in…
- 2020 February
- Demography
- Labour force
- Migration
- NSPA and North Atlantic
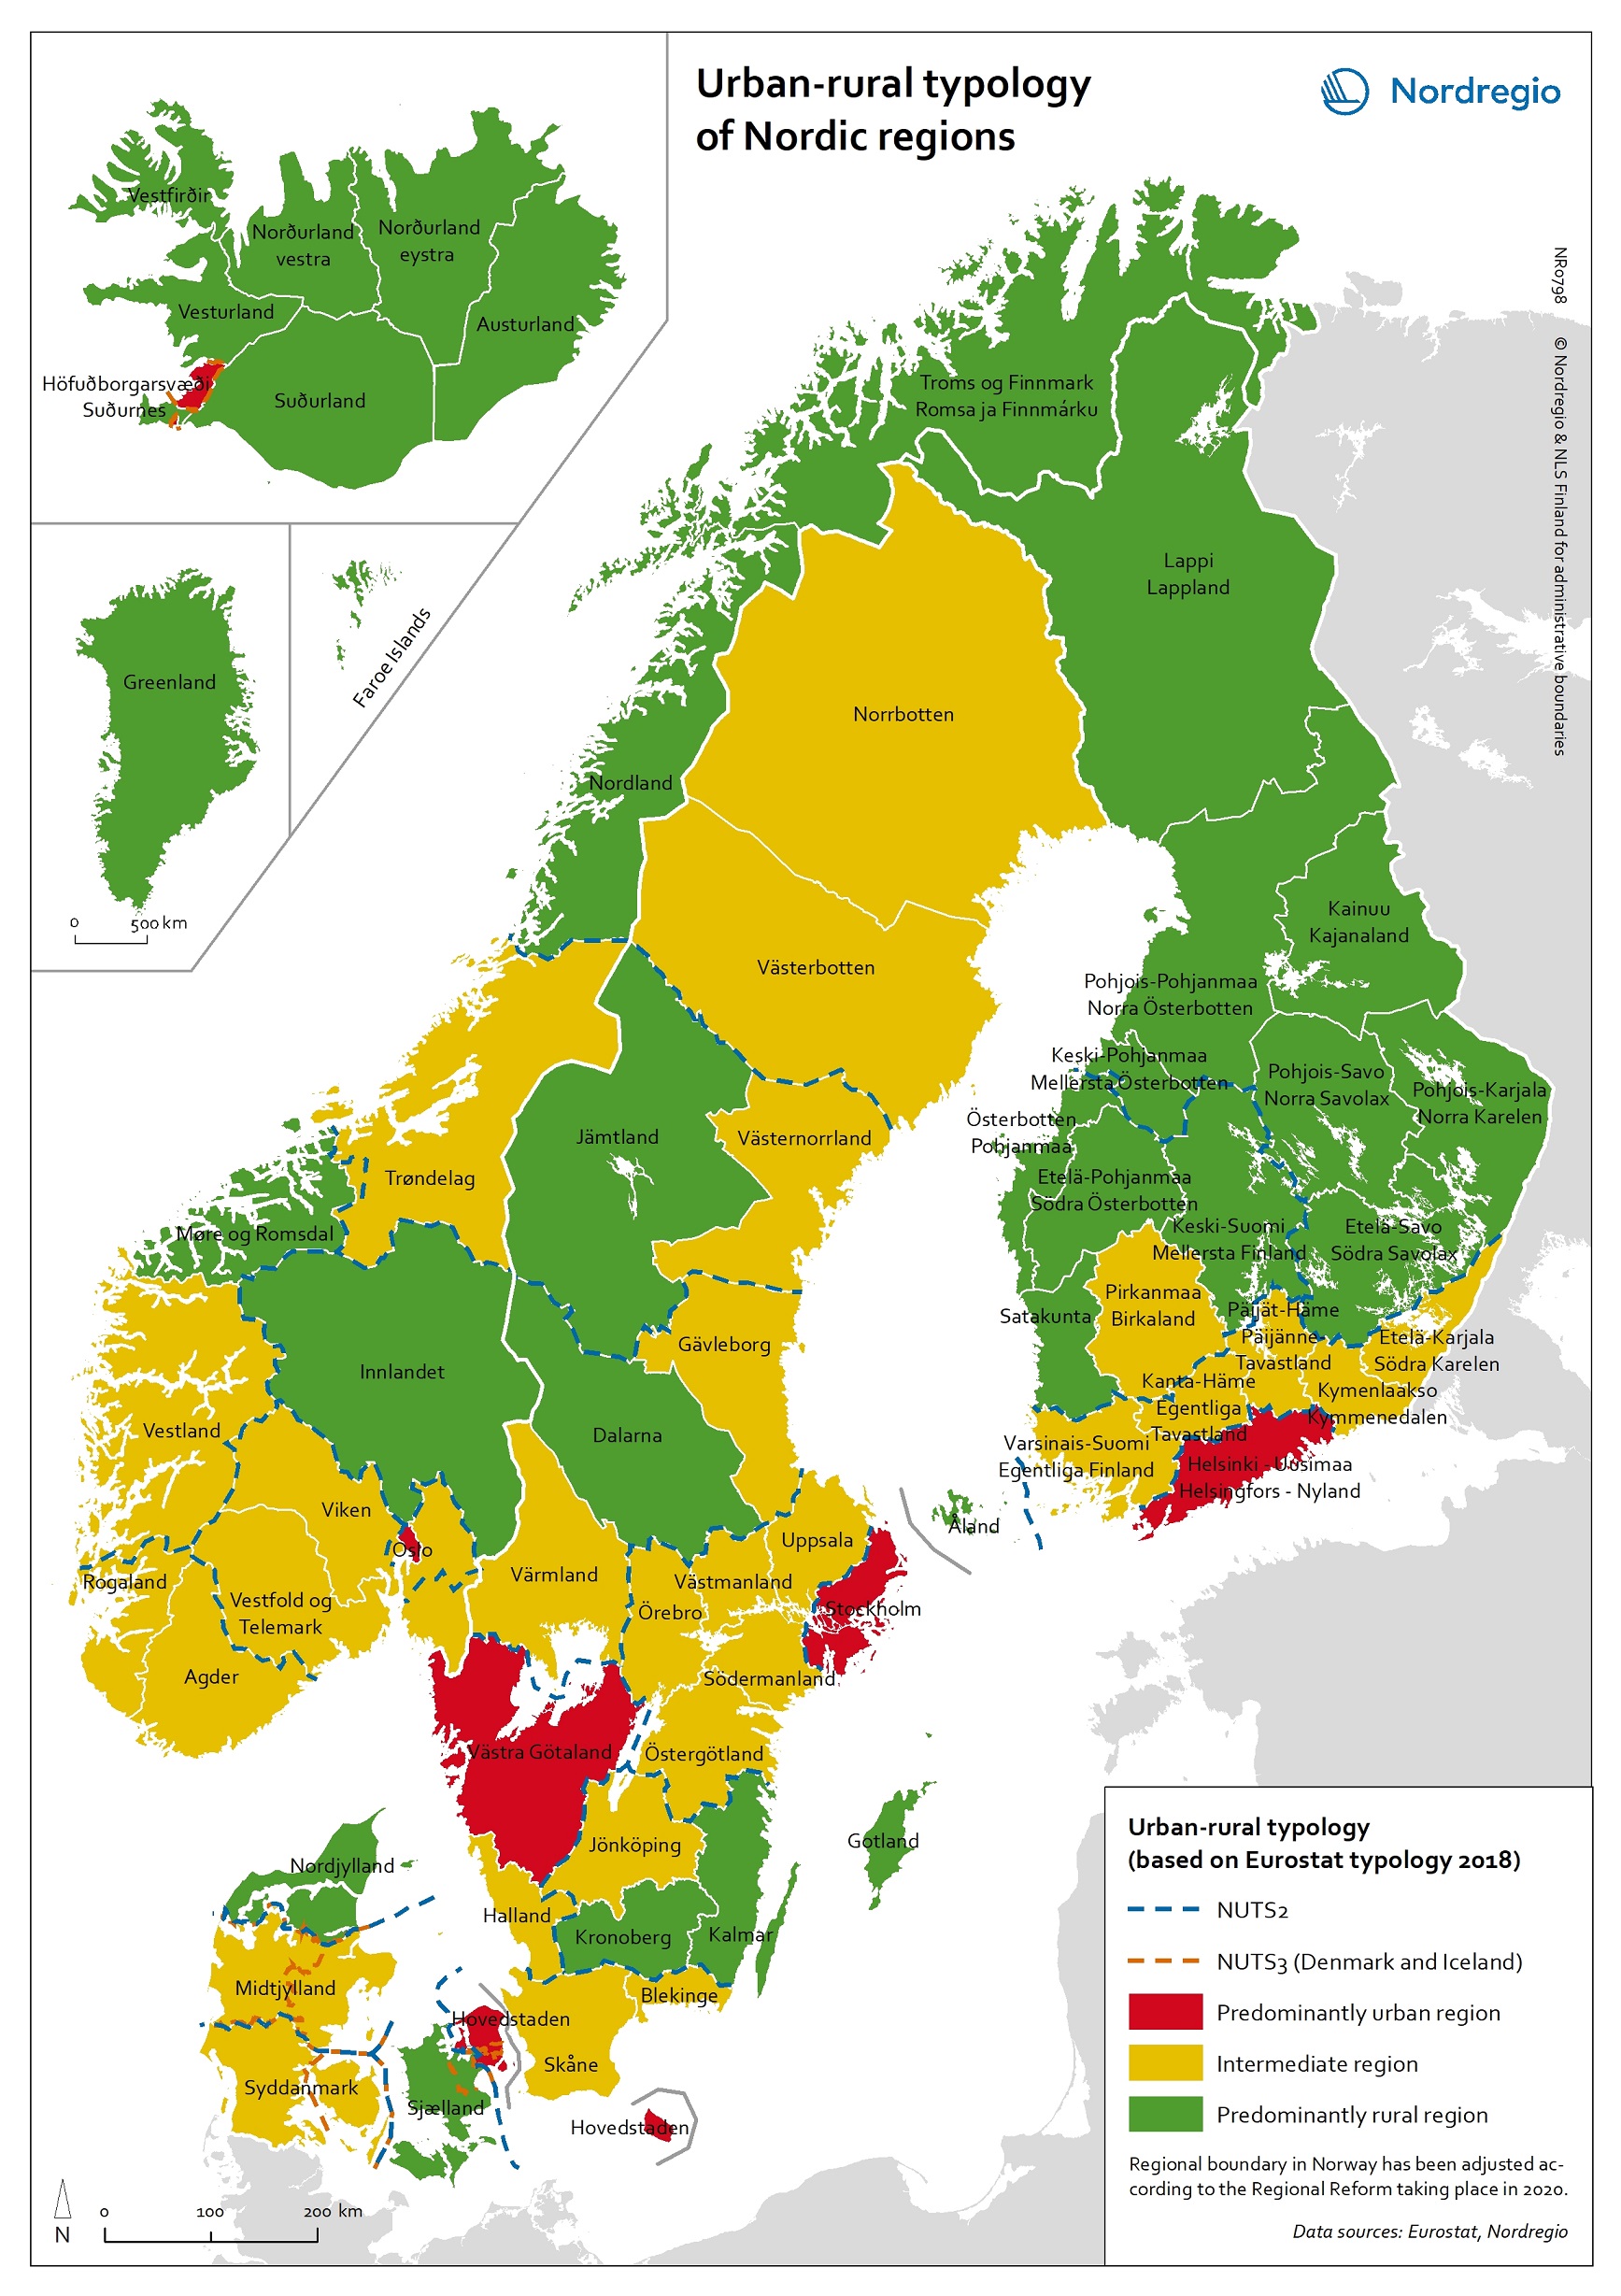
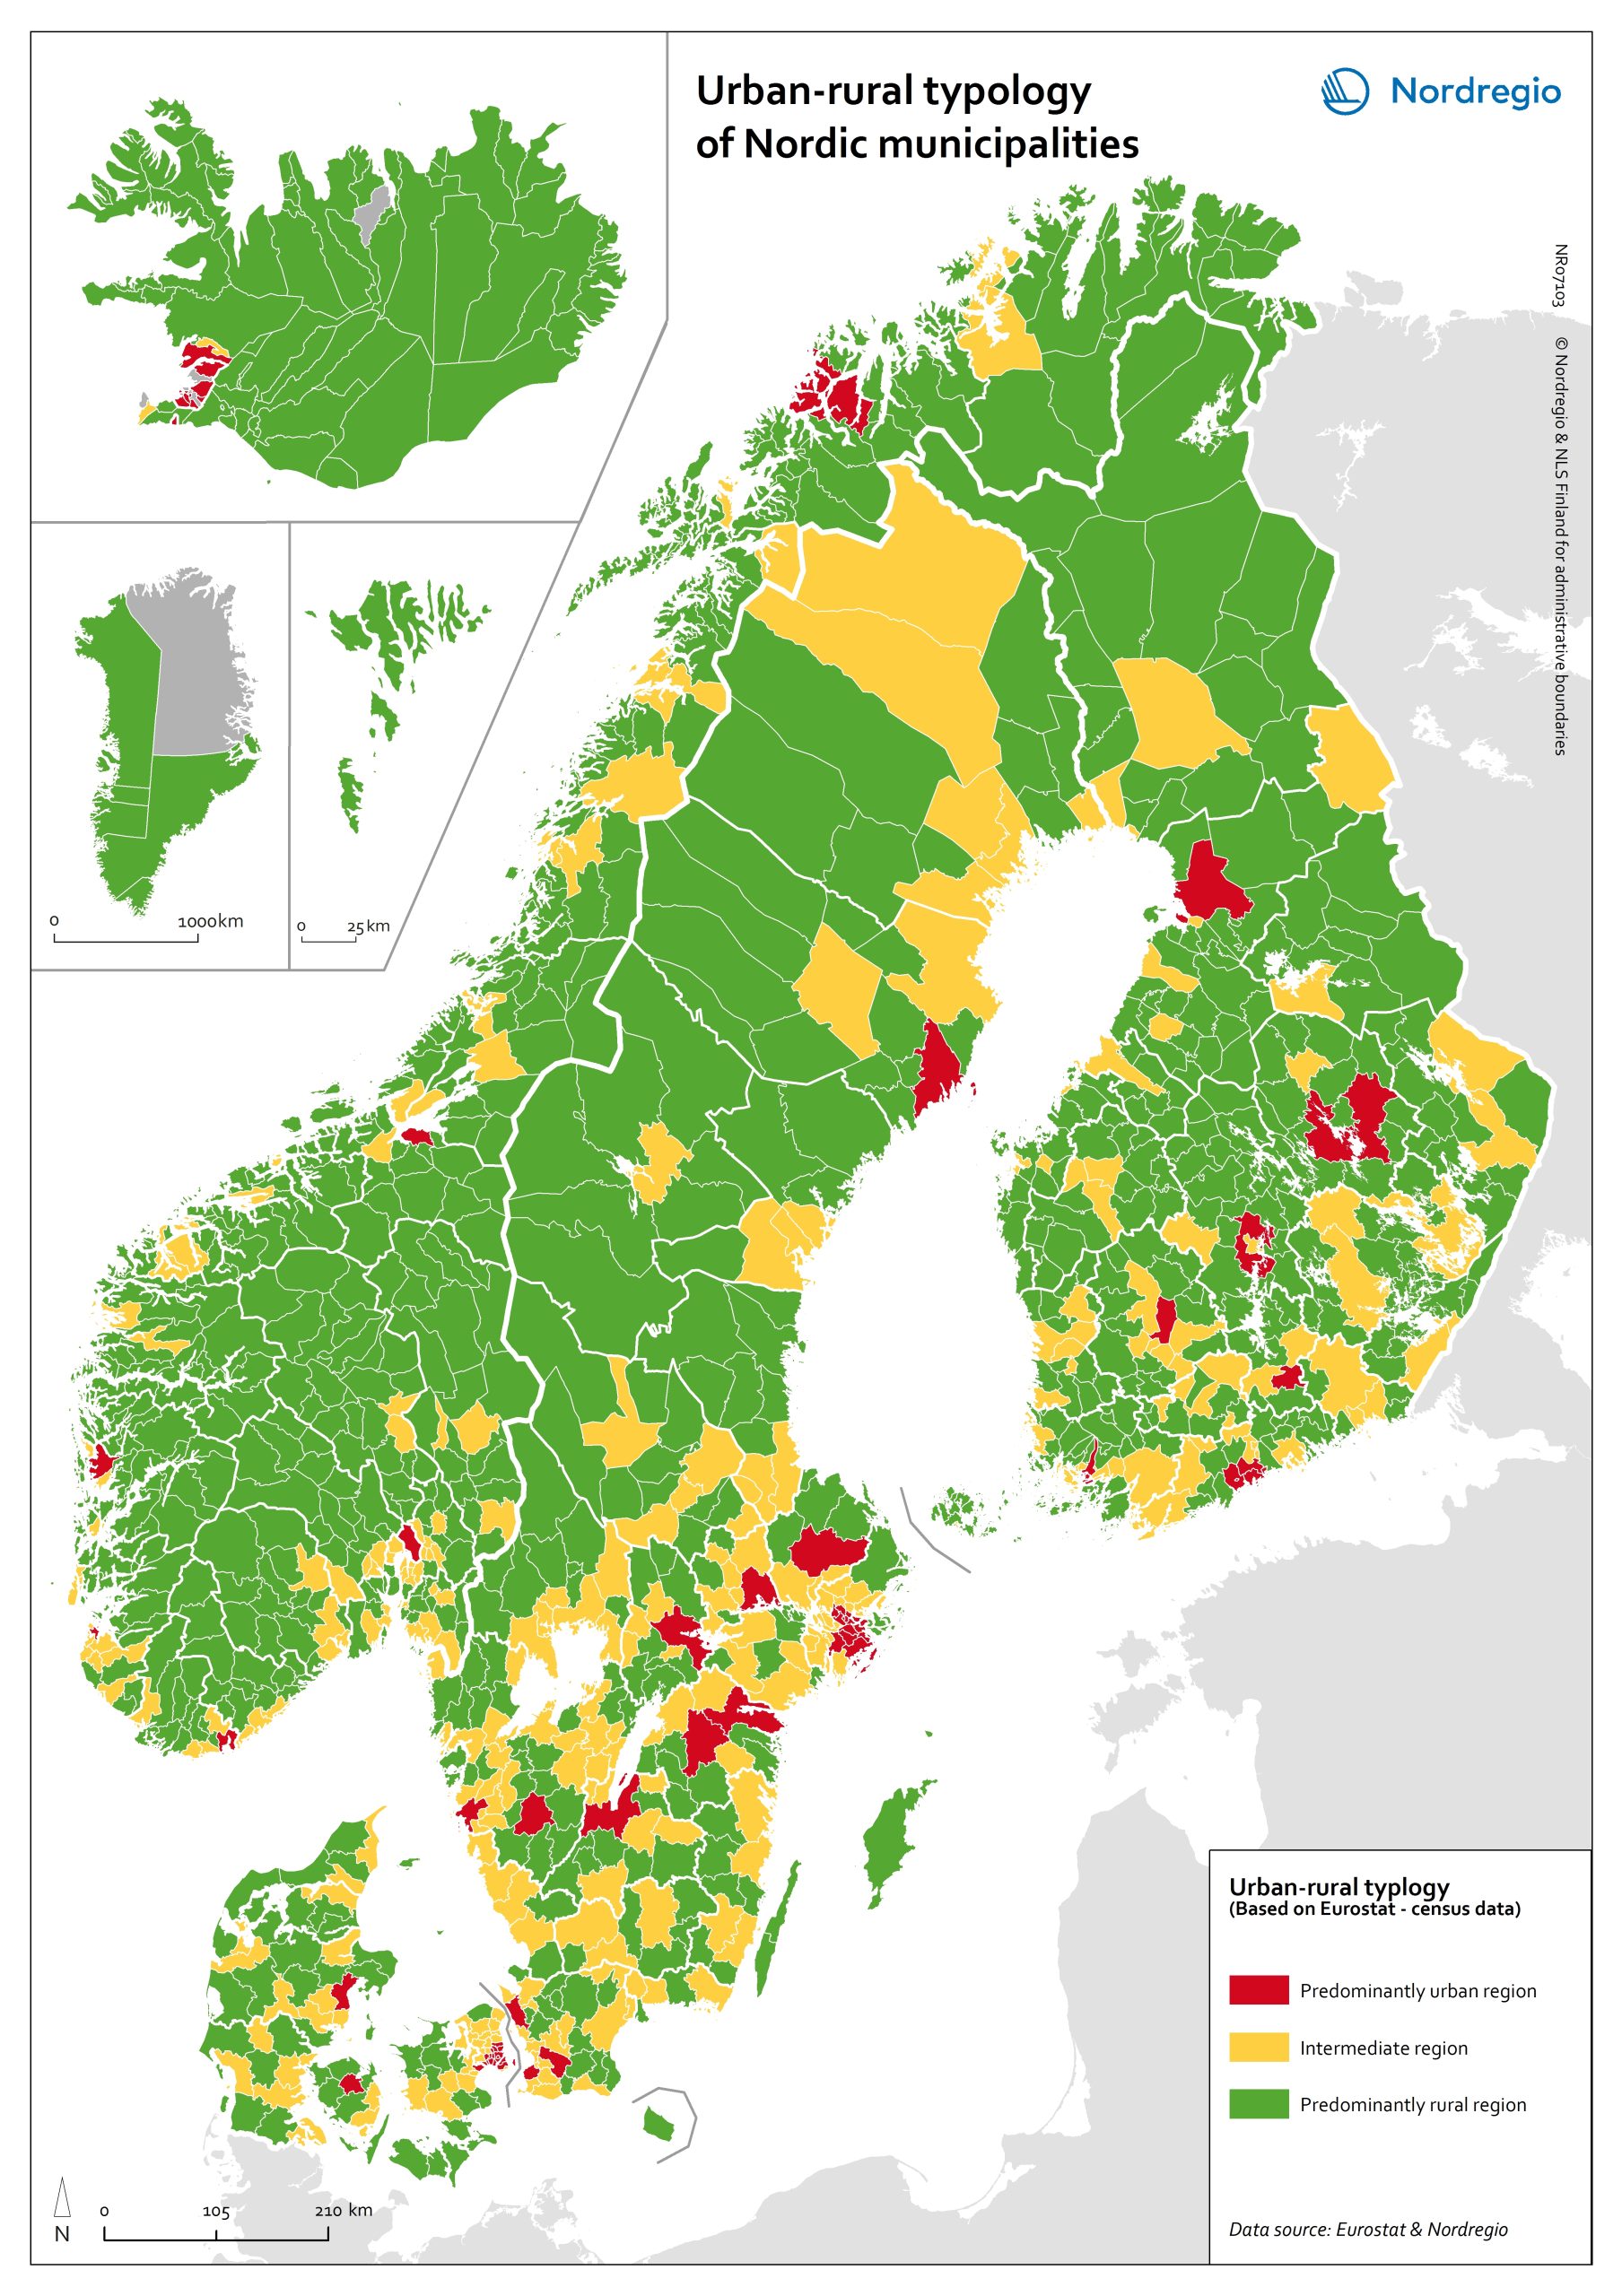
Urban-rural typology of the Nordic regions 2020
This map is included in the introduction of the State of the Nordic Region 2020 report. The map is based on the typology provided by Eurostat (2018), in which the 2016 NUTS 3 regions are classified in three categories according to their population density in 2011 and 2015, in 1 km² grids. In predominantly urban regions, at least 80% of the total population is urban, while in intermediate regions, 50–80% of the population lives in urban clusters. In regions that are predominantly rural, less than 50% of the population lives in urban areas. Read the digital publication here.
- 2020 February
- Administrative and functional divisions
- Nordic Region

Municipalities by degree of urbanisation and functional urban areas
This map shows Nordic municipalities differentiated between their degree of urbanisation. The degree of urbanisation is the relationship between the population living in urban (and rural) areas and the total population of the municipality. The degree of urbanisation is a difficult concept to display but is useful as a way of adding nuance to the debate on urban-rural relations. The map also displays the functional urban areas in the Nordic Region. Cities with at least 50% of the population living in high-density clusters are highlighted in red. Towns and suburbs with less than 50% of the population living in high-density clusters and in rural areas are highlighted in dark blue. Rural areas with more than 50% of the population living in rural areas are highlighted in light blue. Functional urban areas are circled in black. The core cities of the 31 urban functional areas in the Nordic Region correspond to the cities as defined by degree of urbanisation. In the functional urban areas of Esbjerg and Aalborg in Denmark, for instance, there are however no densely populated urban centres. The hinterlands in most functional urban areas in the Nordic Region do include towns and suburbs as well as rural areas. Moreover, municipalities in sparsely populated areas can display a high degree of urbanisation, such as, for example, Kiruna and Gällivare in Sweden. The map is based on data from the Joint Research Center, the OECD Eurostat and EC-DG Region 2011 and 2014. In Iceland, the FUA Reykjavik is represented by NUTS-2 region IS001/Capital region.
- 2018 February
- Administrative and functional divisions
- Nordic Region
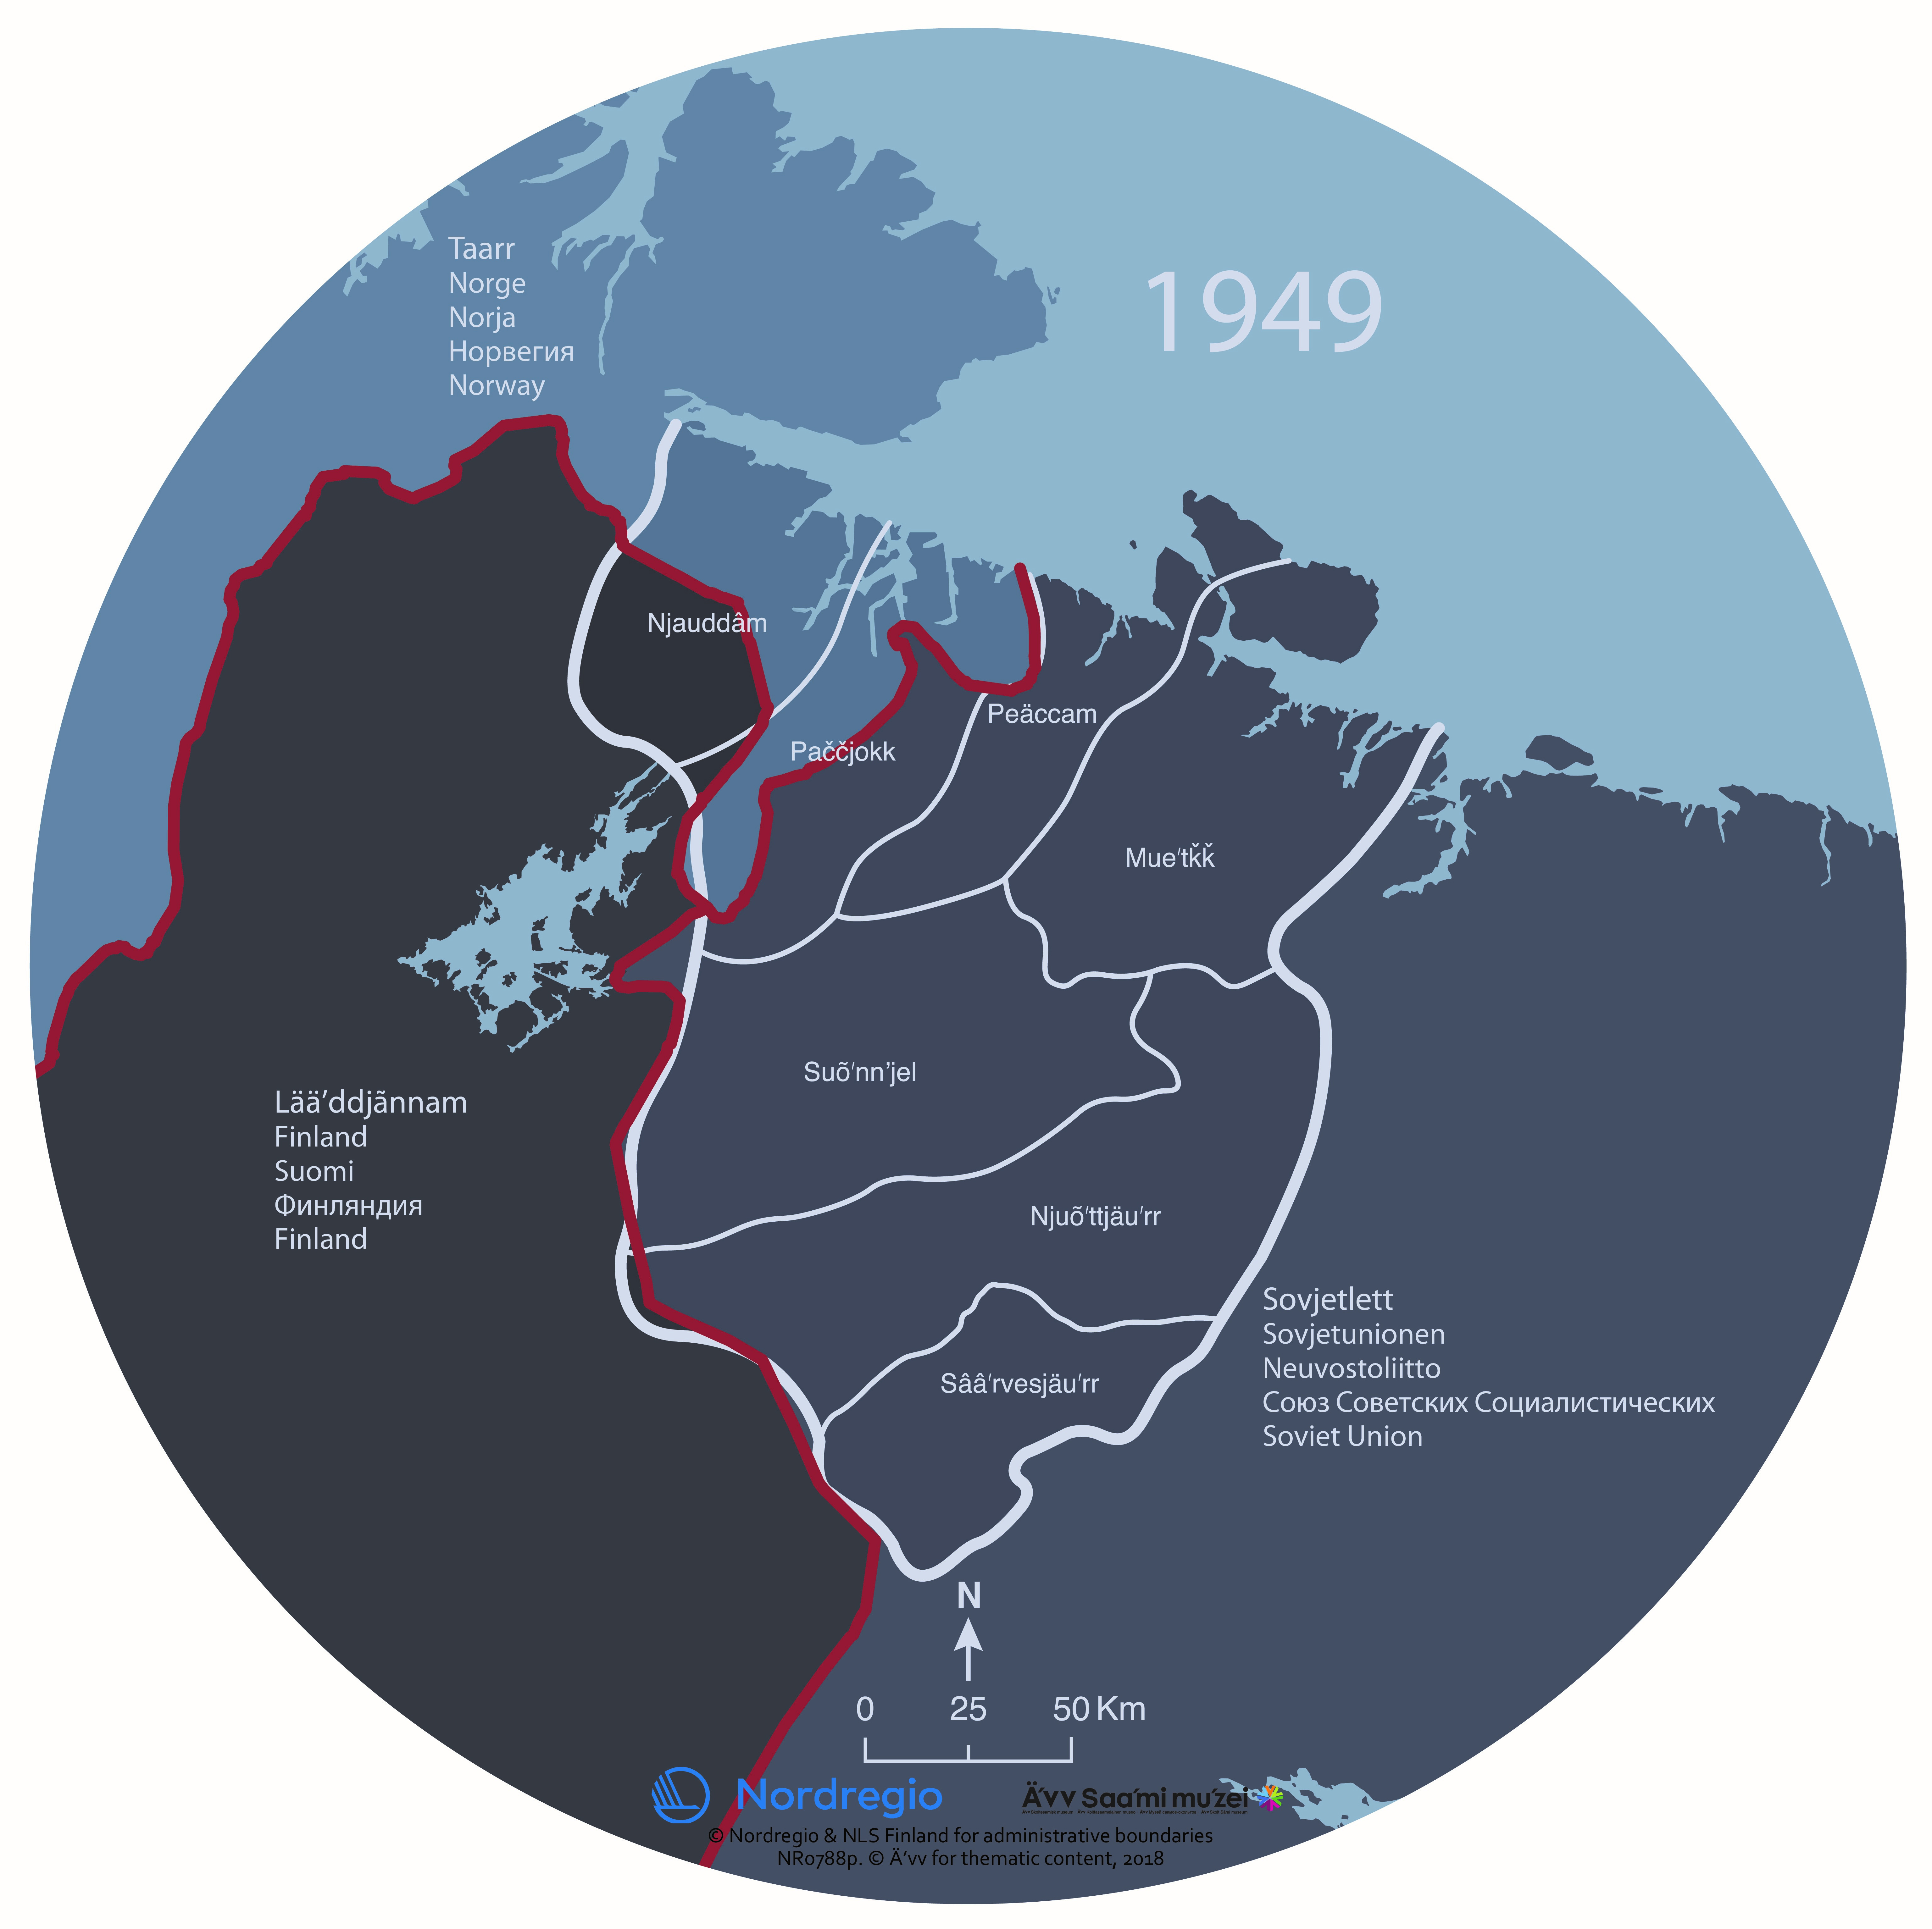
Saaʹmijânnam – Borders: 1949
The map shows the Skolt Sámi Land and the borders of national states in 1949. The Skolt Sámi Land is the home area for the indigenous Skolt Sámi people. During the Second World War, the Skolt Sámi land was the stage of violent acts of war. After the war, borders were again redrawn. The Soviet Union took the Petsamo area from Finland. The Skolt Sámi of Petsamo were given new settlement areas in north eastern Finland. In Norway and the Soviet Union, the Skolt Sámi remained an invisible minority. In all three countries, there was very little space for the Sámi. It took decades before the human rights of the Sámi received any attention. The map was produced for the exhibition Saaʹmijânnam – The Skolt Sámi Land in Äʹvv Skolt Sámi museum in Neiden, Norway. The map is the result of a collaboration between Äʹvv Skolt Sámi museum (responsible for the reconstruction of the Skolt Sámi areas and the exhibition), Yngvar Julin (concept of maps and exhibition architect), Nordregio (base maps) and Rethink. and illustrator Ruth Thomlevold (graphic design). Back to the main project page.
- 2018 January
- Administrative and functional divisions
- Arctic
